Power BI Portfolio
Client-ready deck
A standalone portfolio for demos: real use cases, mockup visuals, and trusted client logos.
Snapshot
Demo ReadyDashboards
100+
Industries
14
Prototype
24 hrs
Accuracy
98%
Figures indicative of delivery capability.
Trusted by leading organisations


Power BI Showcase
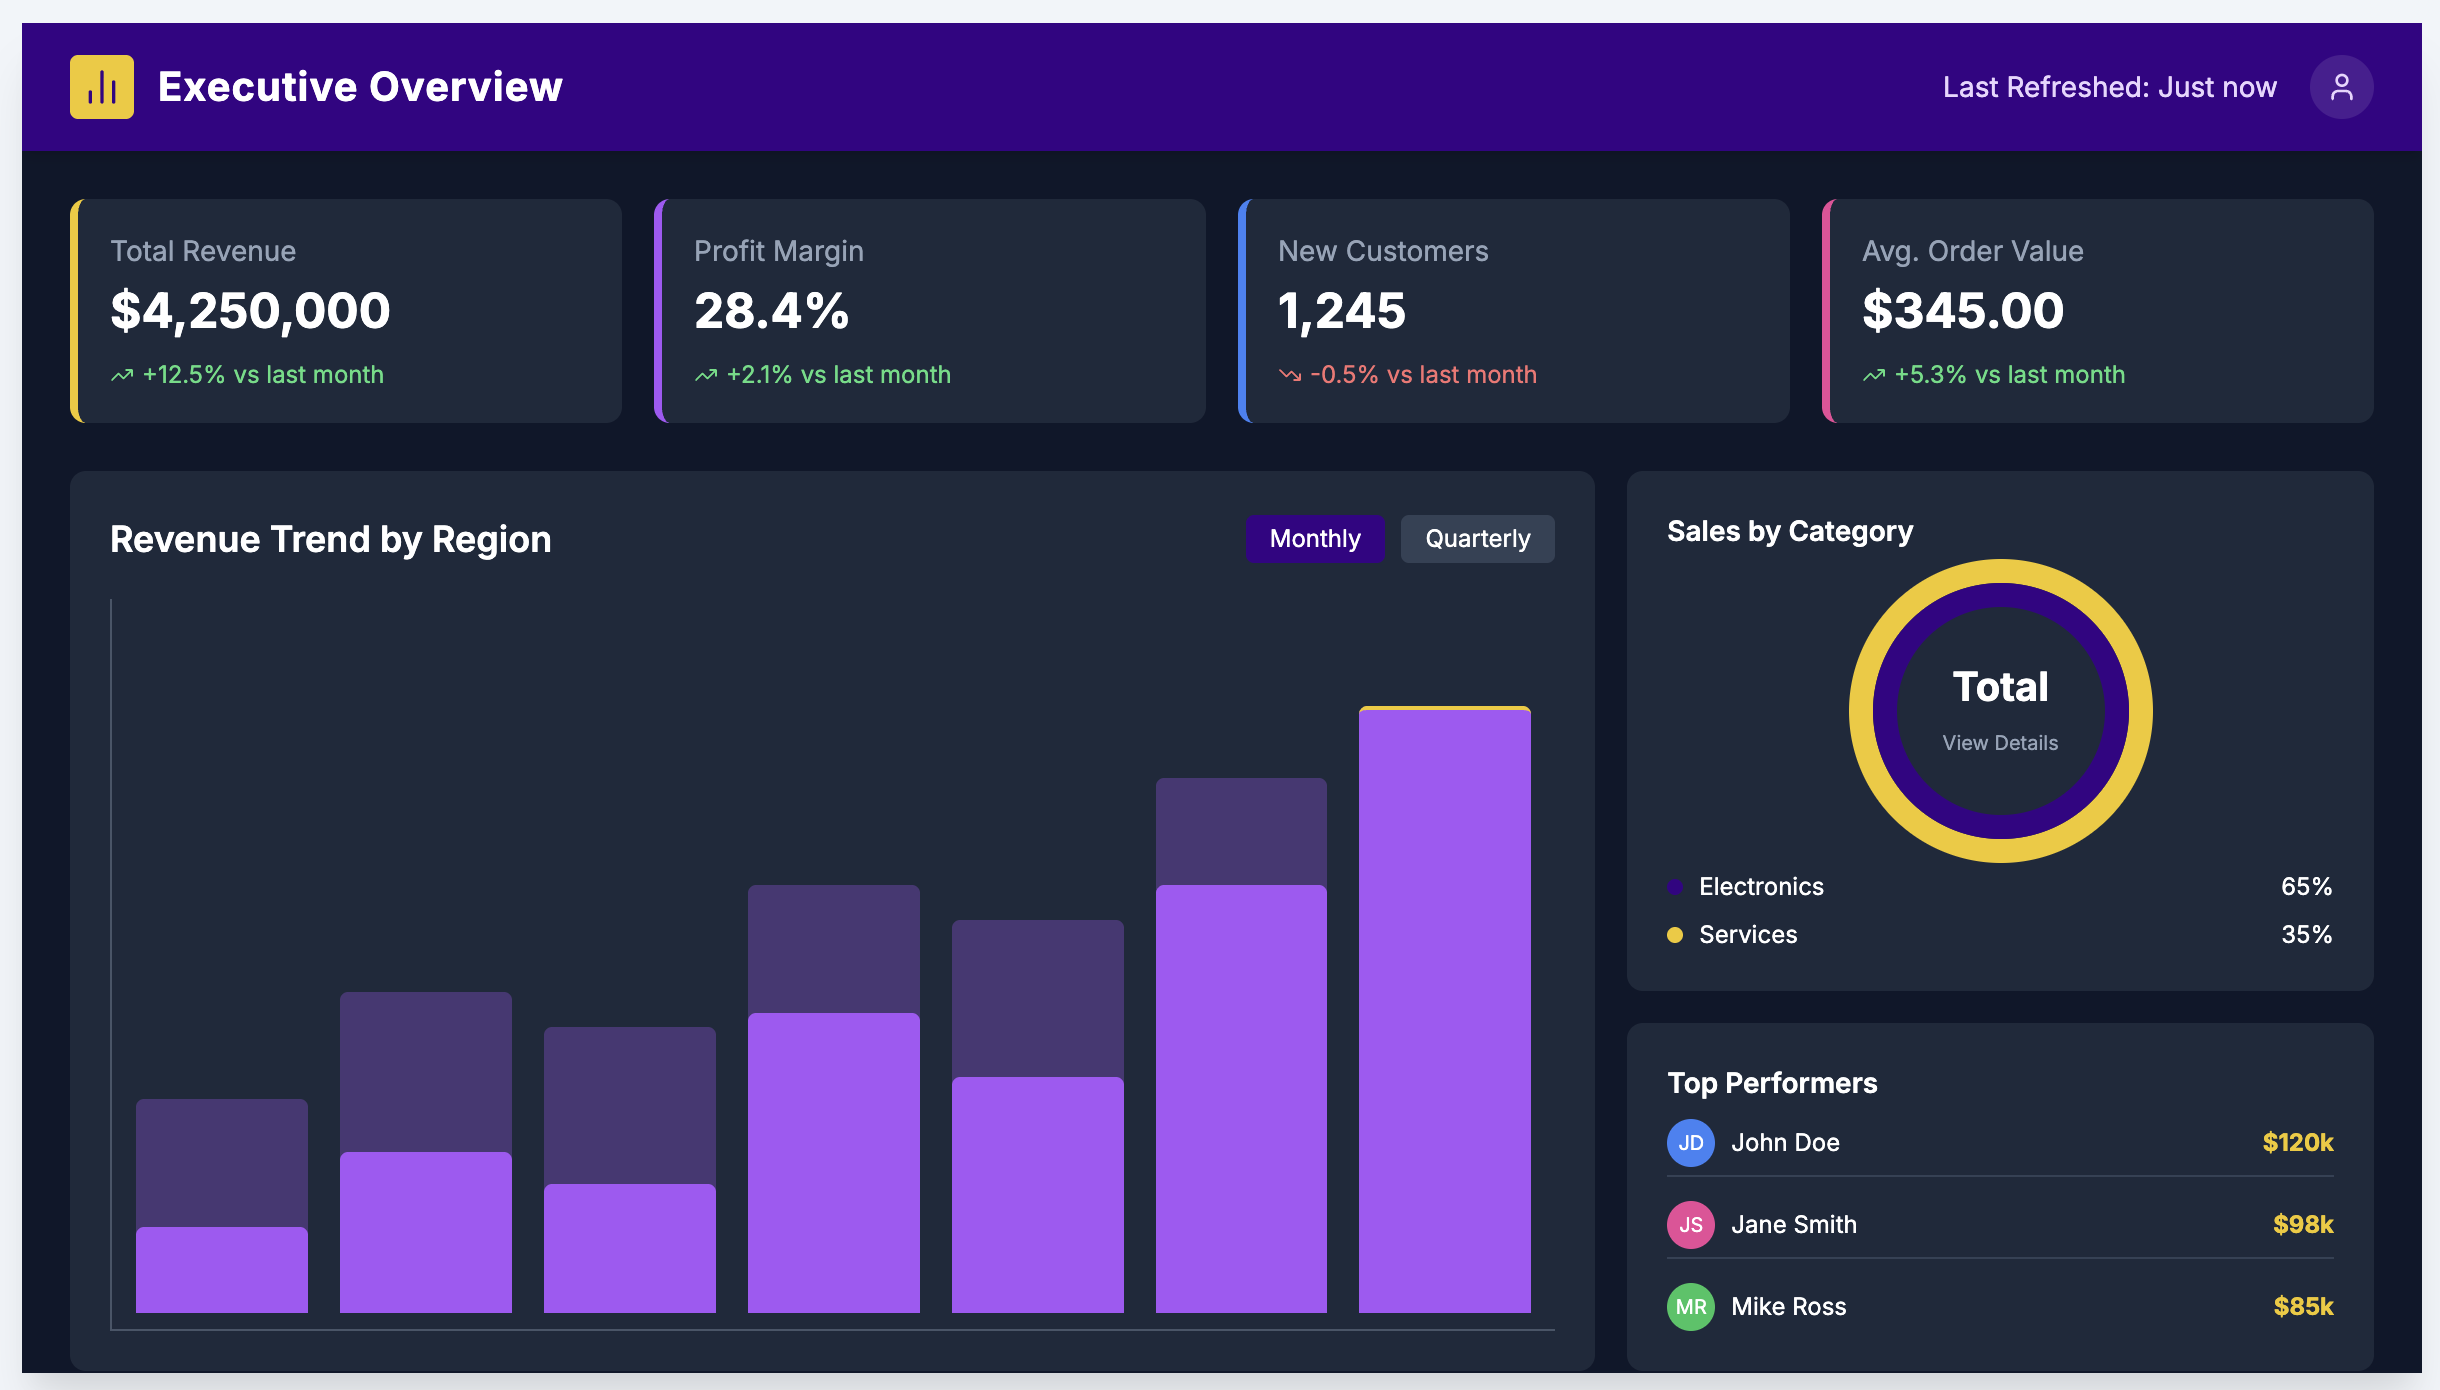
Executive
Built for the board pack: a weekly executive view that stitches ERP revenue, CRM pipeline, and finance margins into one page. Leaders can confirm growth against plan, spot margin compression by region, and drill into the month’s anomaly without waiting for the finance team.
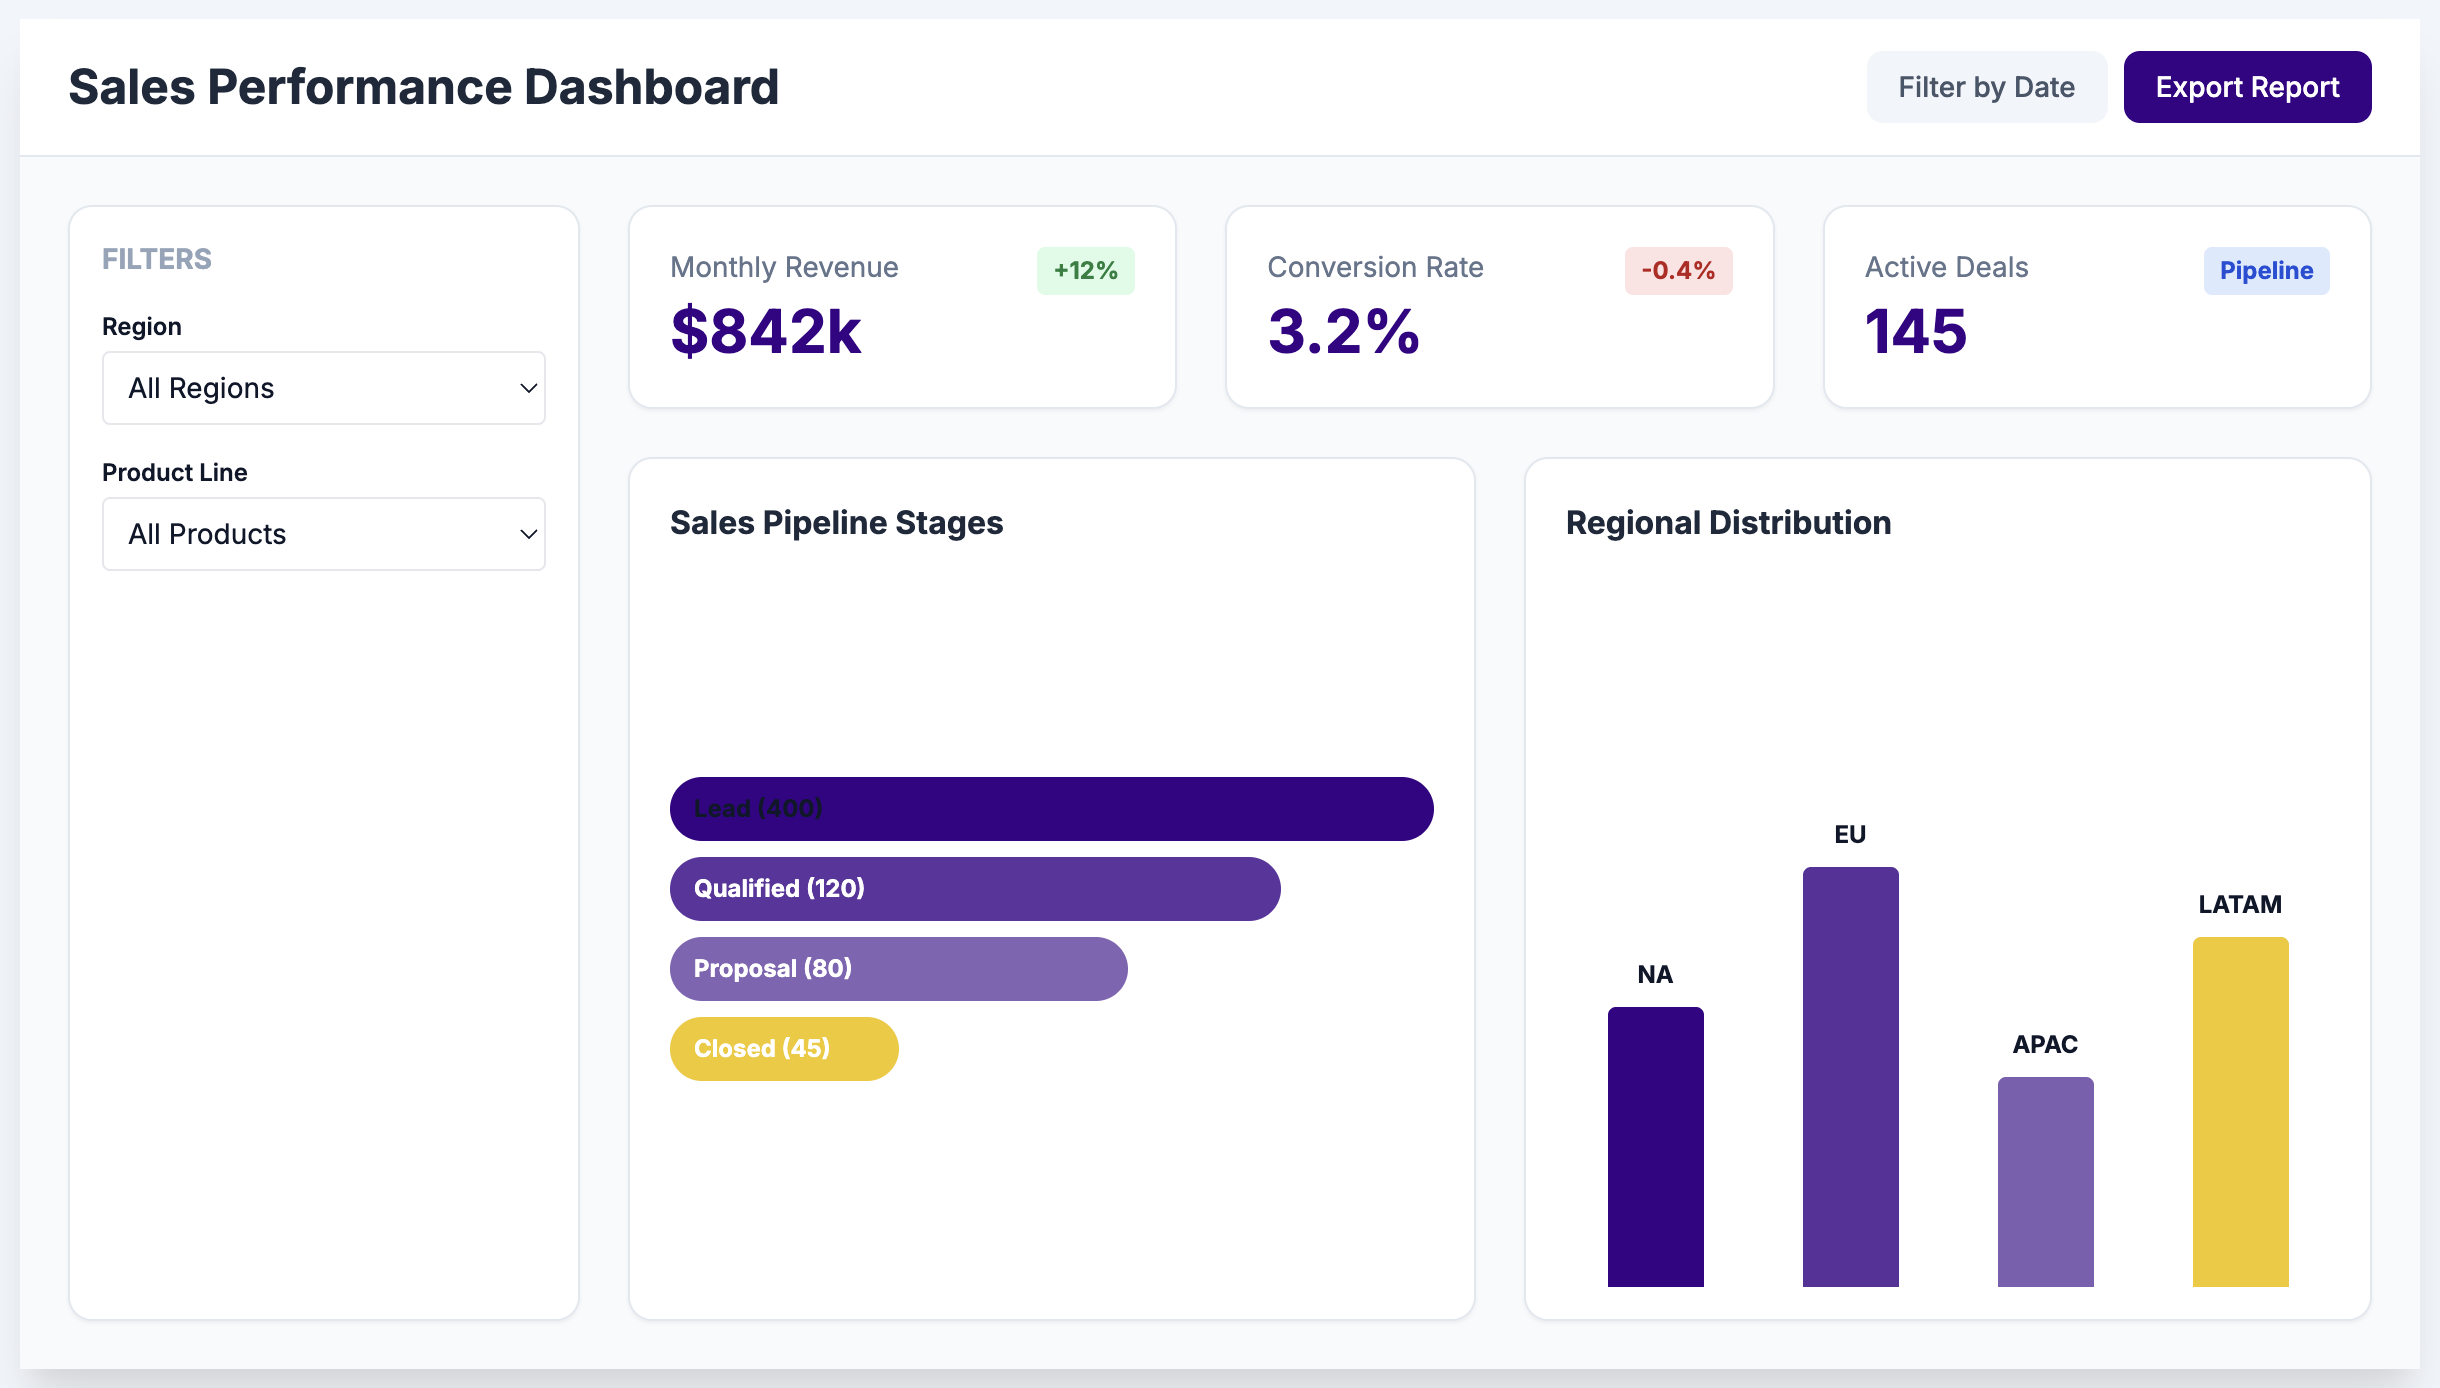
Sales
Created for a national sales team that needed one source of truth for weekly performance. It blends CRM opportunities, lead sources, and conversion stages to show where deals stall, which territories are outperforming, and which reps need coaching before quarter end.
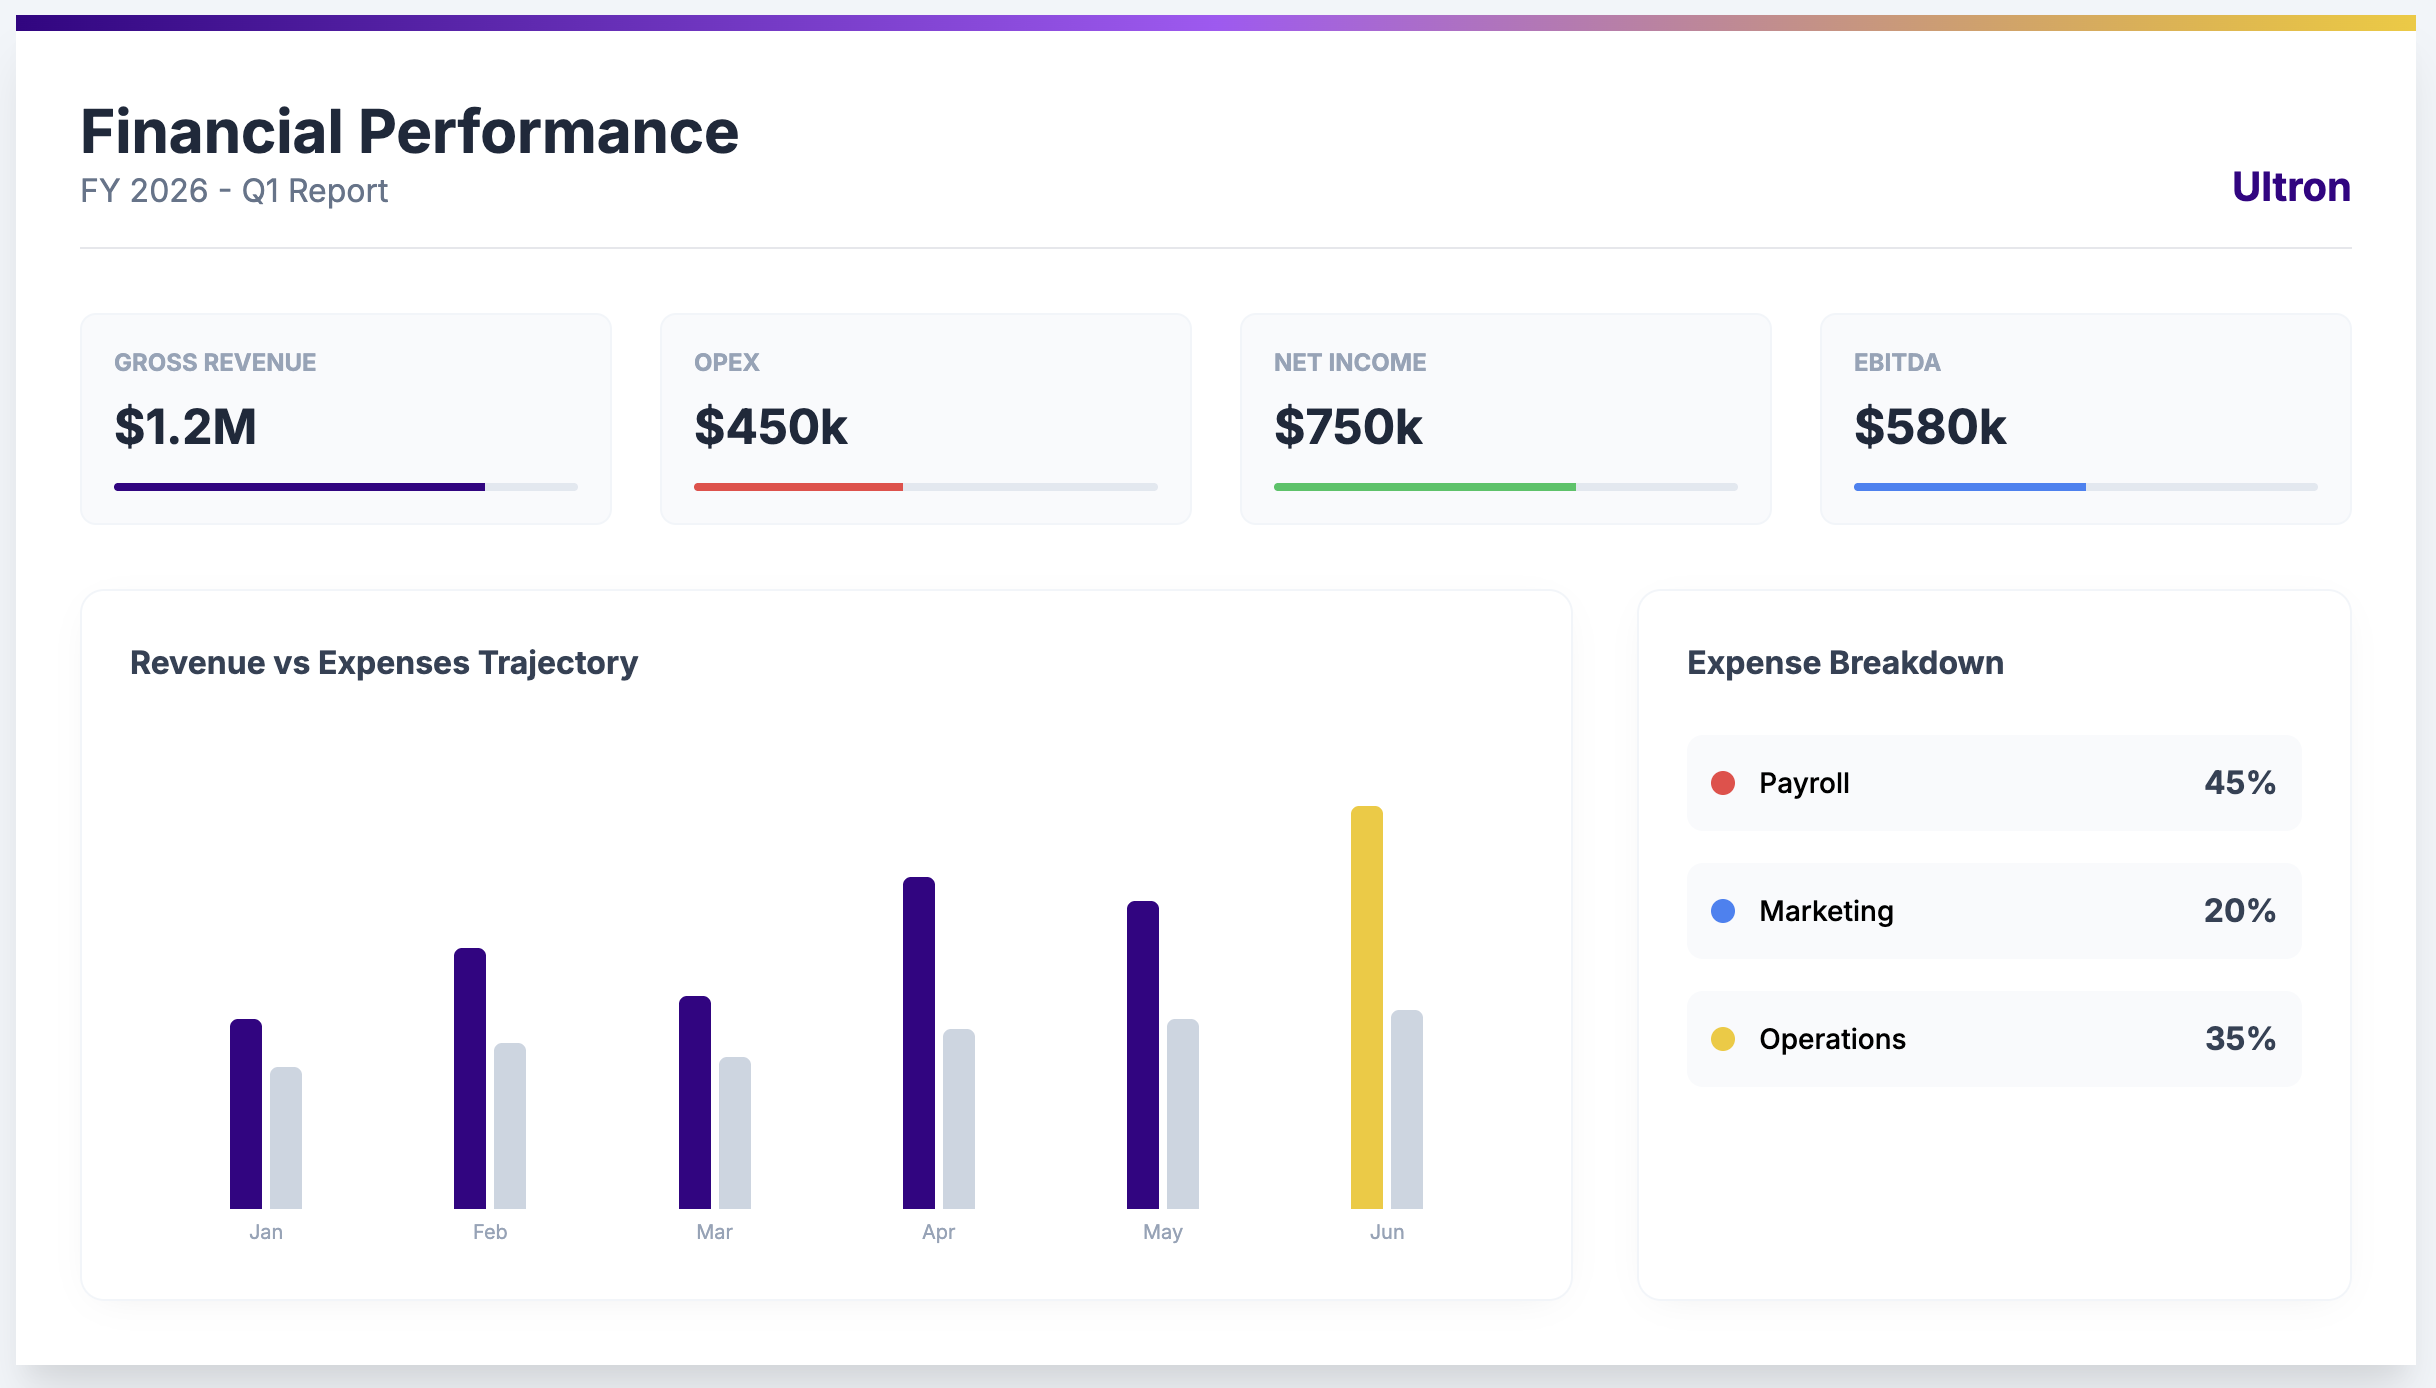
Finance
Designed for CFO review: the dashboard consolidates GL, payroll, and vendor spend to show EBITDA movement, expense spikes, and budget variance by cost centre. It tells a clear story for monthly close and highlights where cash leakage is hiding.
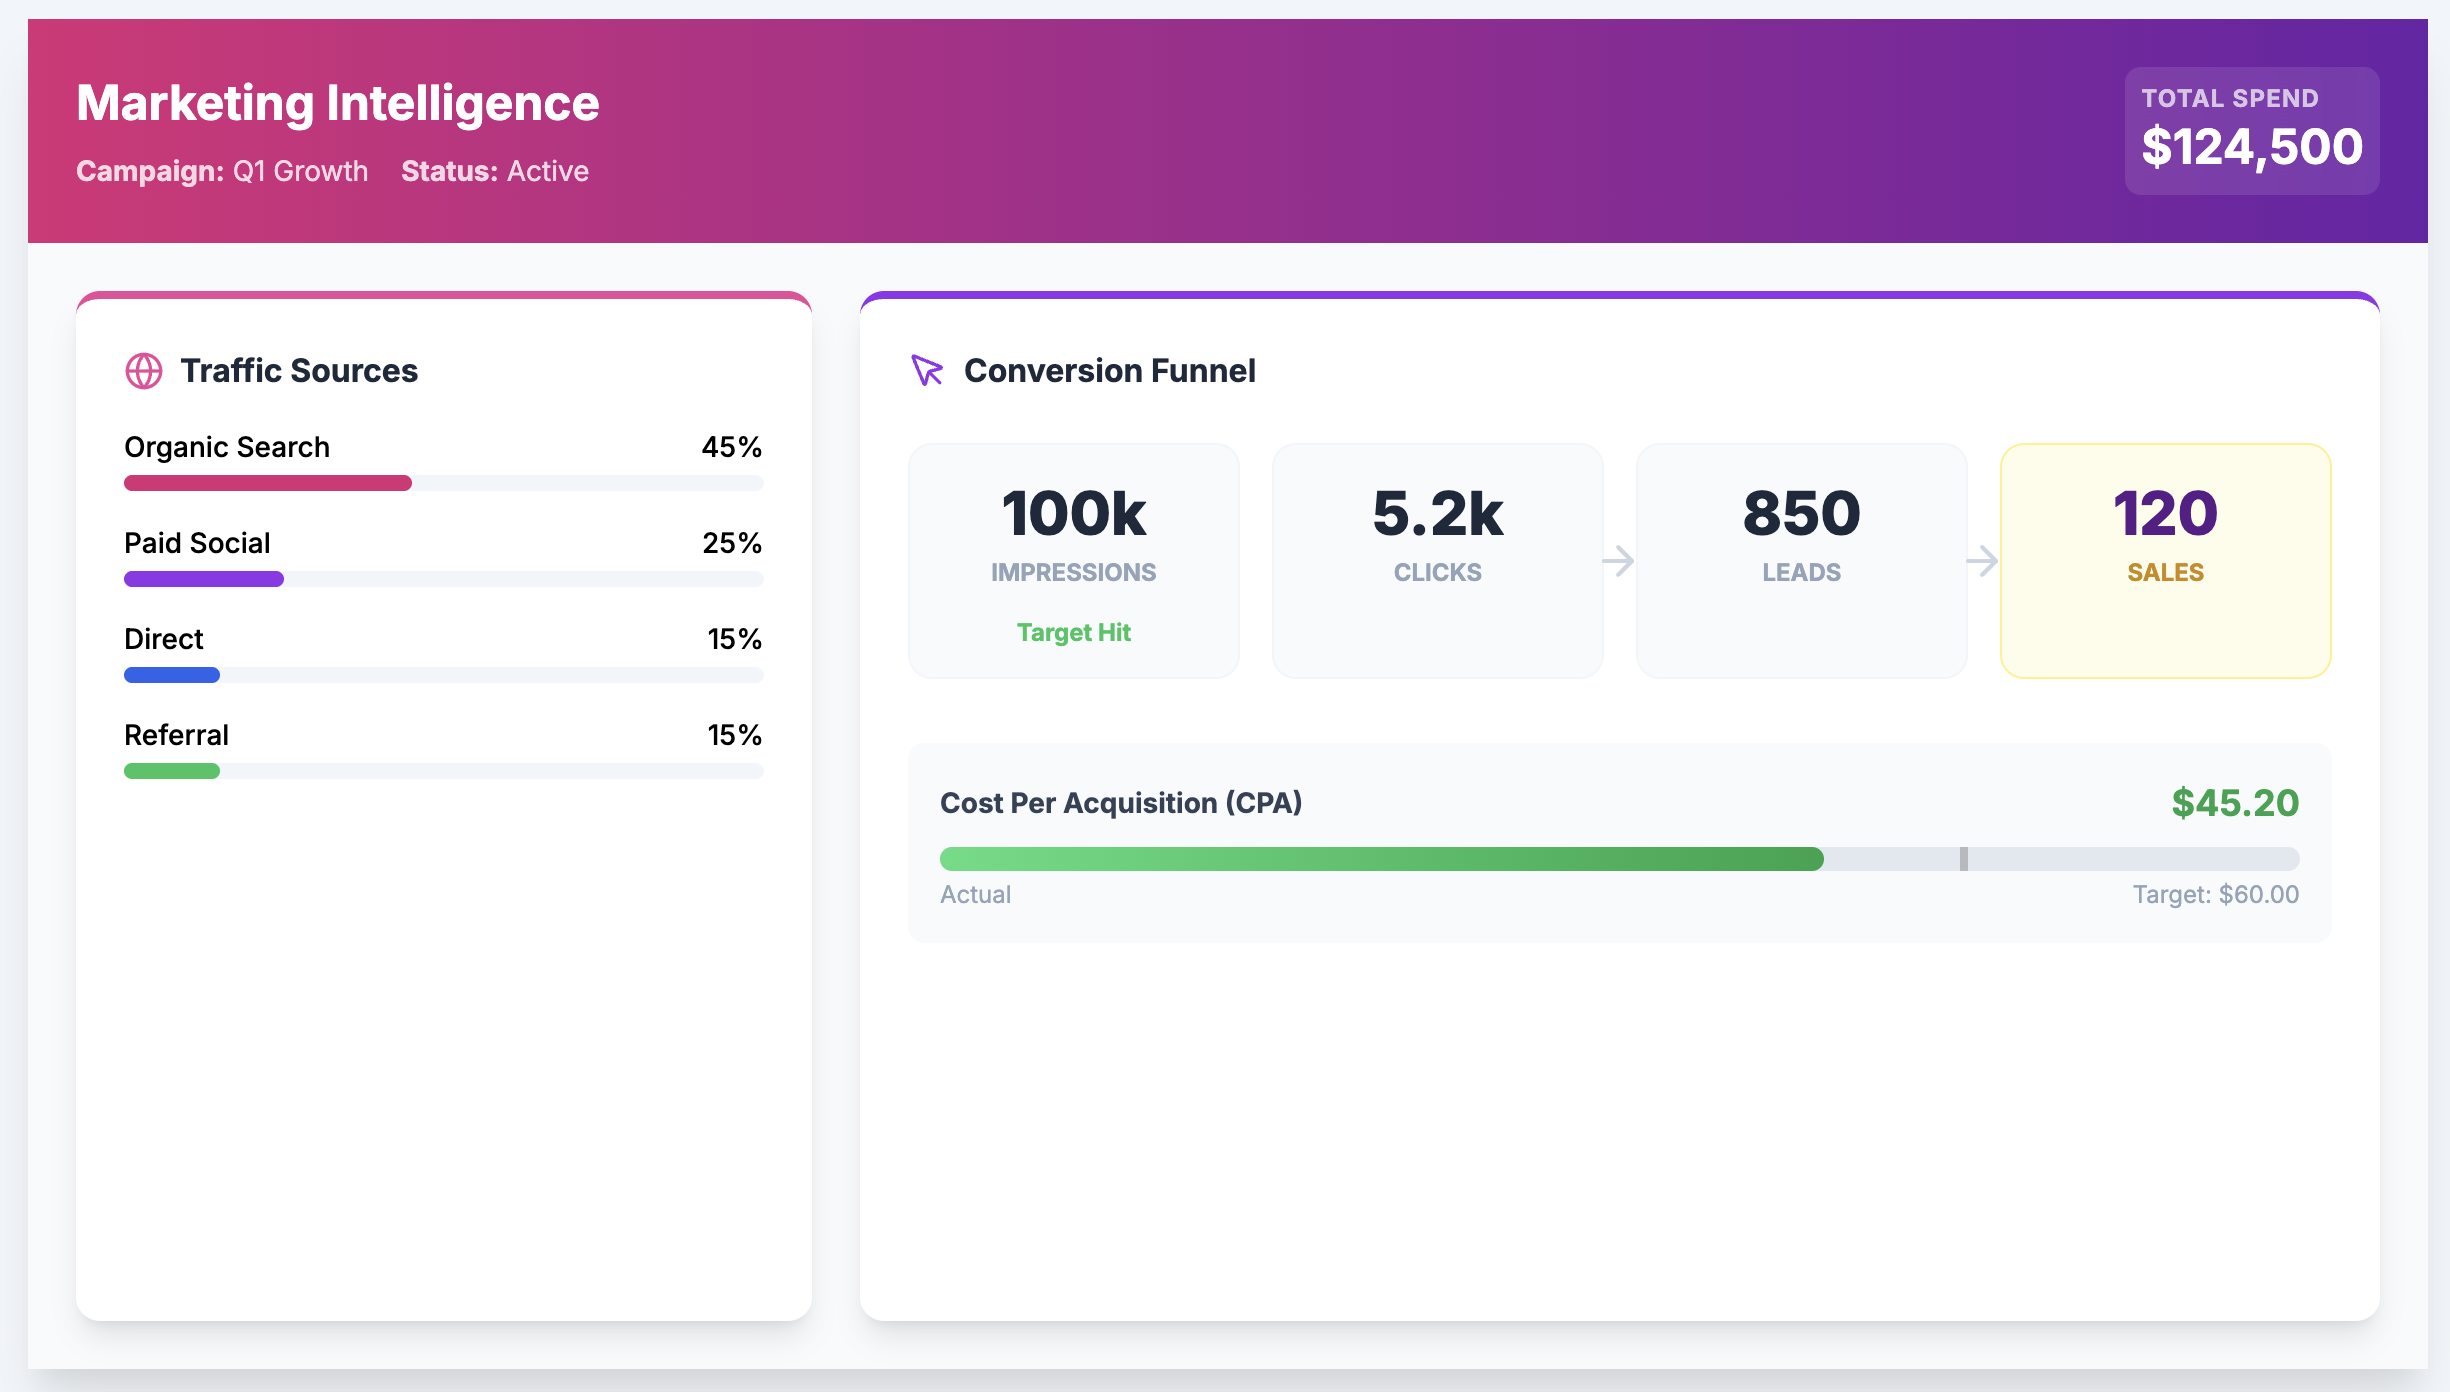
Marketing
Built for a performance marketing team managing multi‑channel spend. It ties ad platforms to web analytics and CRM outcomes, showing true ROI, which campaigns drive pipeline, and where budget should shift for the next sprint.
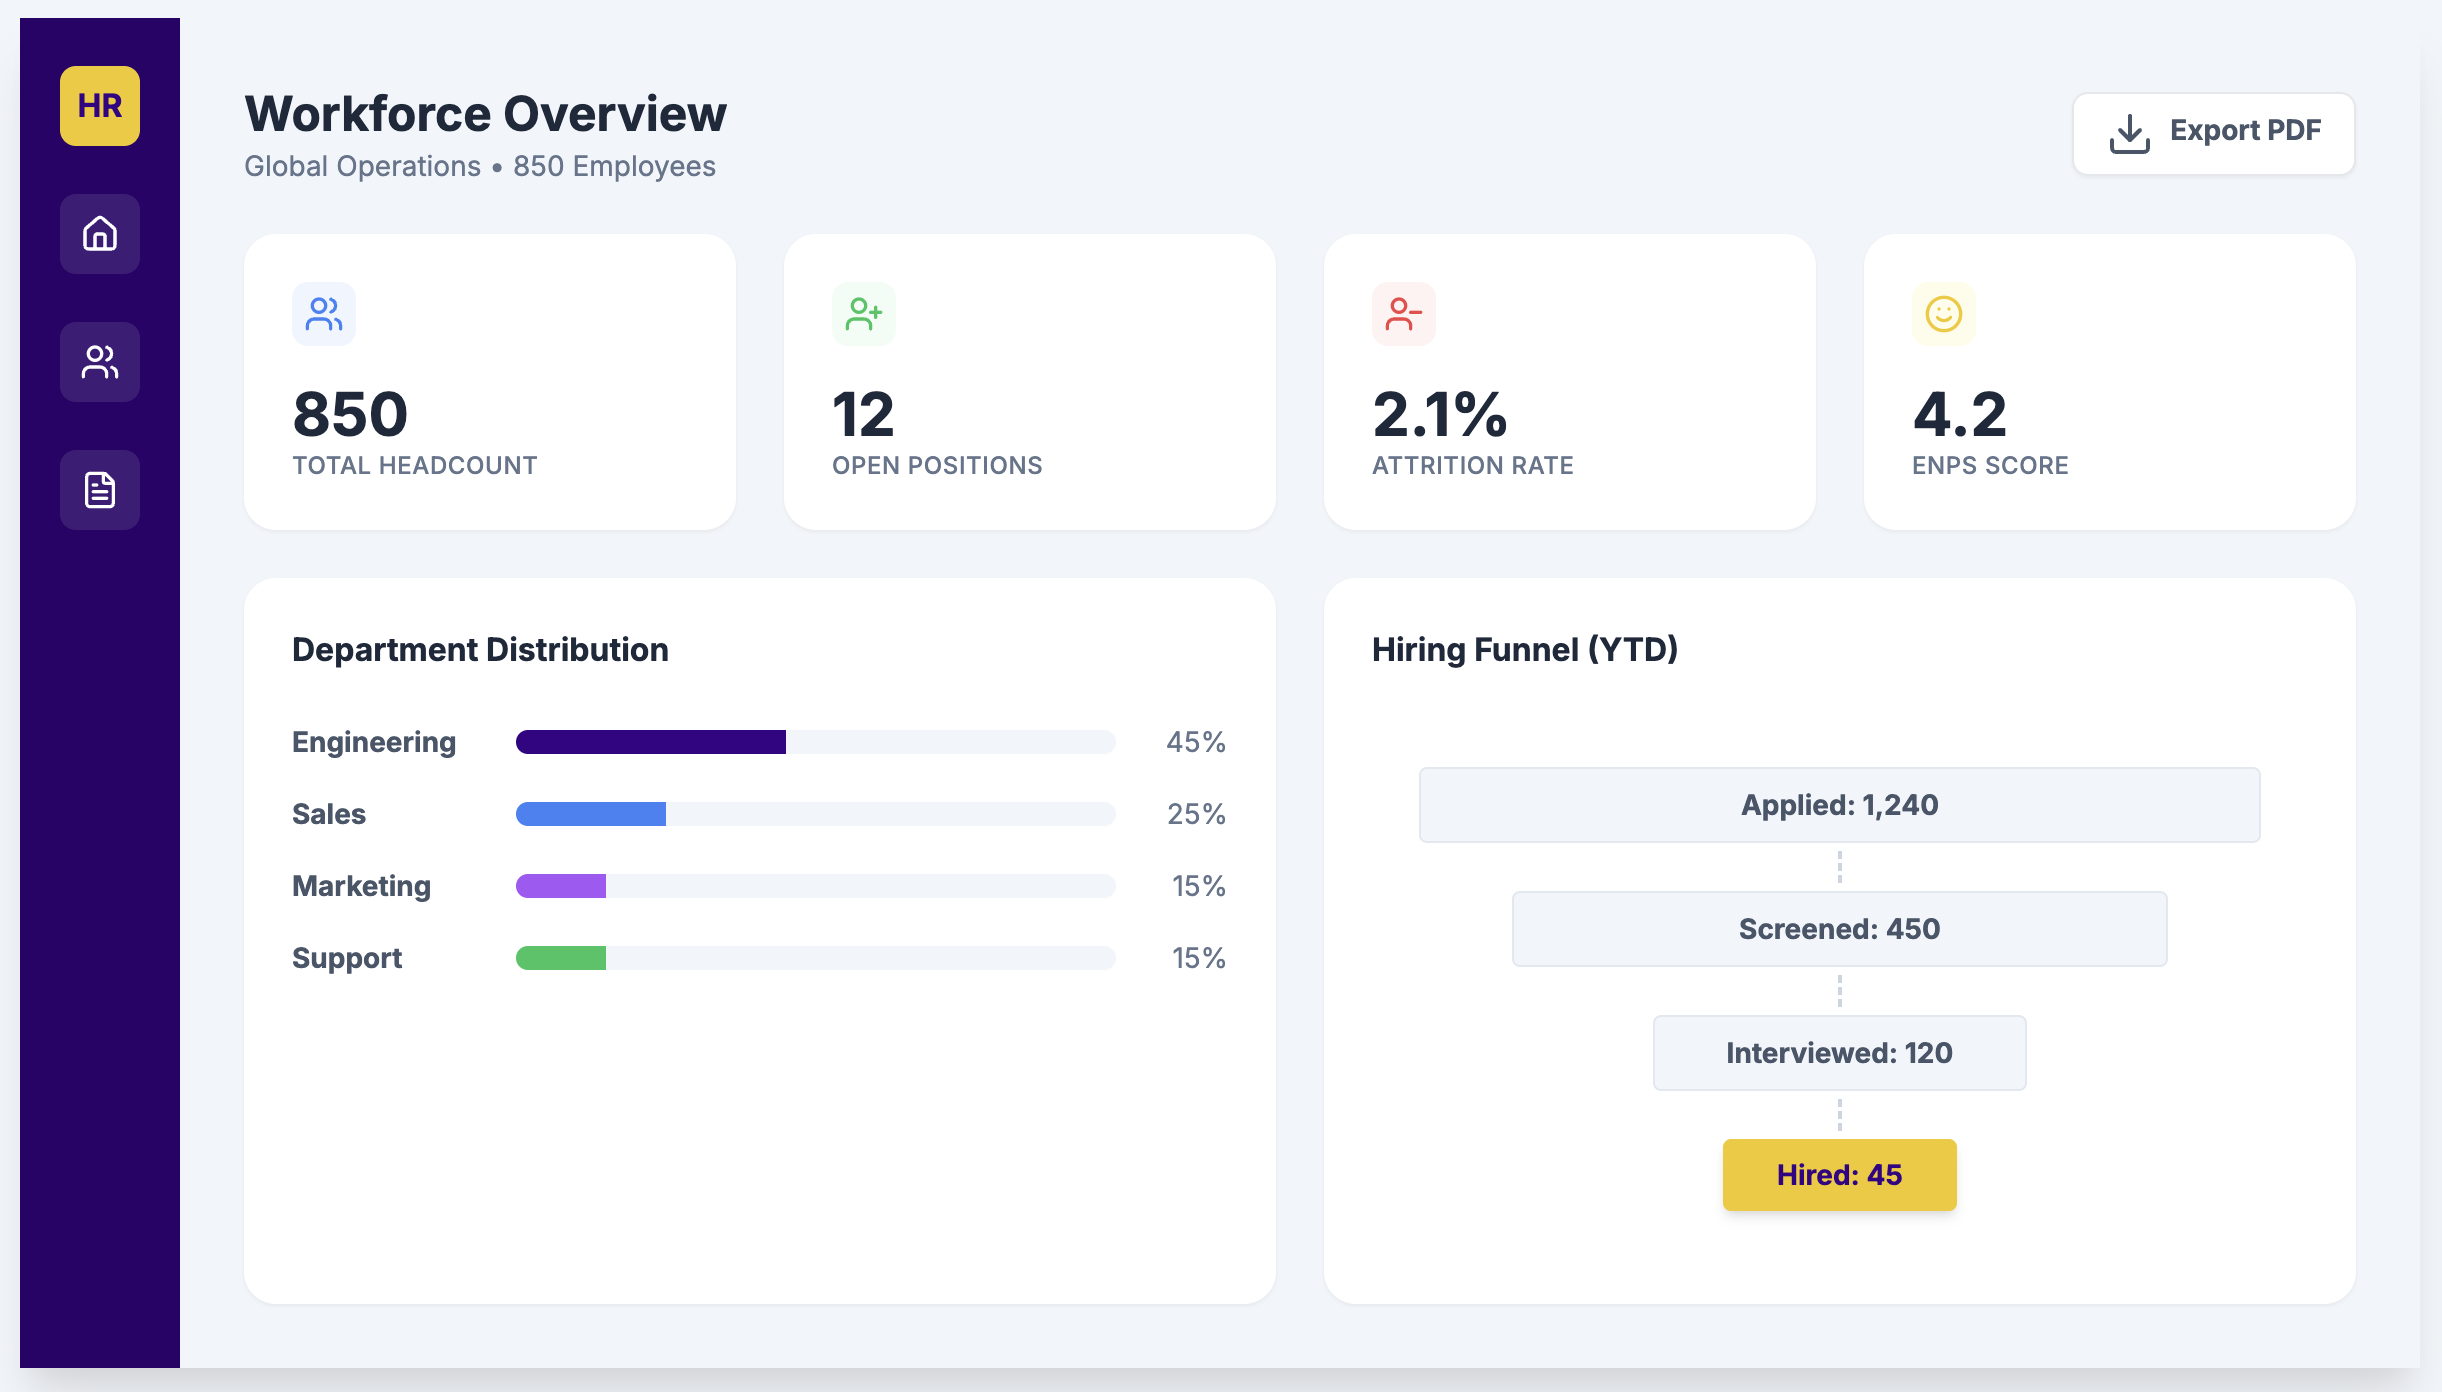
People
Created for HR and workforce planners to understand hiring velocity, attrition risk, and utilisation across teams. It merges HRIS and project allocation data so leaders can forecast capacity gaps before they impact delivery.
Operations
Designed for operations managers overseeing multiple sites. It unifies production, QA, and logistics feeds to show where throughput drops, which lines are blocked, and how delays cascade into missed delivery windows.
Operations Control
Throughput
1,248
Cycle Time
3.6h
On-Time
94%
Line Output (units)
Bottlenecks
Customer
Built for customer success teams needing a single view of account health. It combines product usage, support tickets, and survey feedback to flag renewal risk early and prioritize proactive outreach.
Customer Health
NPS
52
Adoption
78%
Renewal Risk
14%
Health Trend
Top Accounts
PMO
Created for PMO leadership to see portfolio risk at a glance. It blends project plans, time tracking, and finance data to show budget burn, milestone slippage, and resource bottlenecks before programs drift off track.
Portfolio Snapshot
Budget Used
62%
Milestones
48
Capacity
81%
Program Timeline
Supply Chain
Built for supply chain teams balancing inventory and service levels. It surfaces slow‑moving stock, supplier delays, and backorder pressure so planners can reallocate orders before stockouts hit customers.
Inventory Overview
Turns
8.2
Lead Time
14d
Backorders
3%
Stock by Category
Top Suppliers
IT
Designed for IT service leadership to track incident load and SLA compliance. It blends ticketing data with staffing to reveal where queues are building, which categories breach SLAs, and how improvements impact resolution time.
Service Desk
Tickets
3,420
SLA Met
96%
FRT
42m
Ticket Trend
SLA by Priority
Slide 1 of 10
We build Power BI solutions that connect data sources, automate refresh, and deliver insights that stick.
Operations Control
Live status across sites
Throughput
1,248
Cycle Time
3.6h
On-Time
94%
Scrap Rate
2.1%
Line Output (units)
Bottlenecks
Customer Health
CS Leadership View
NPS
52
Adoption
78%
Renewal Risk
14%
Tickets
42
Health Trend
Top Accounts
Portfolio Snapshot
PMO Overview
Budget Used
62%
Milestones
48
Capacity
81%
ROI
1.4x
Program Timeline
Inventory Overview
Supply Chain
Turns
8.2
Lead Time
14d
Backorders
3%
Stockouts
1.2%
Stock by Category
Top Suppliers
Service Desk
IT Ops
Tickets
3,420
SLA Met
96%
FRT
42m
CSAT
4.6
Ticket Trend
SLA by Priority