
Executive clarity
Board-ready views with consistent KPIs, exceptions, and drill-down paths.
From semantic models and DAX through governance, implementation, handover and support, we build Power BI and Fabric reporting foundations around the decisions your team needs to make.
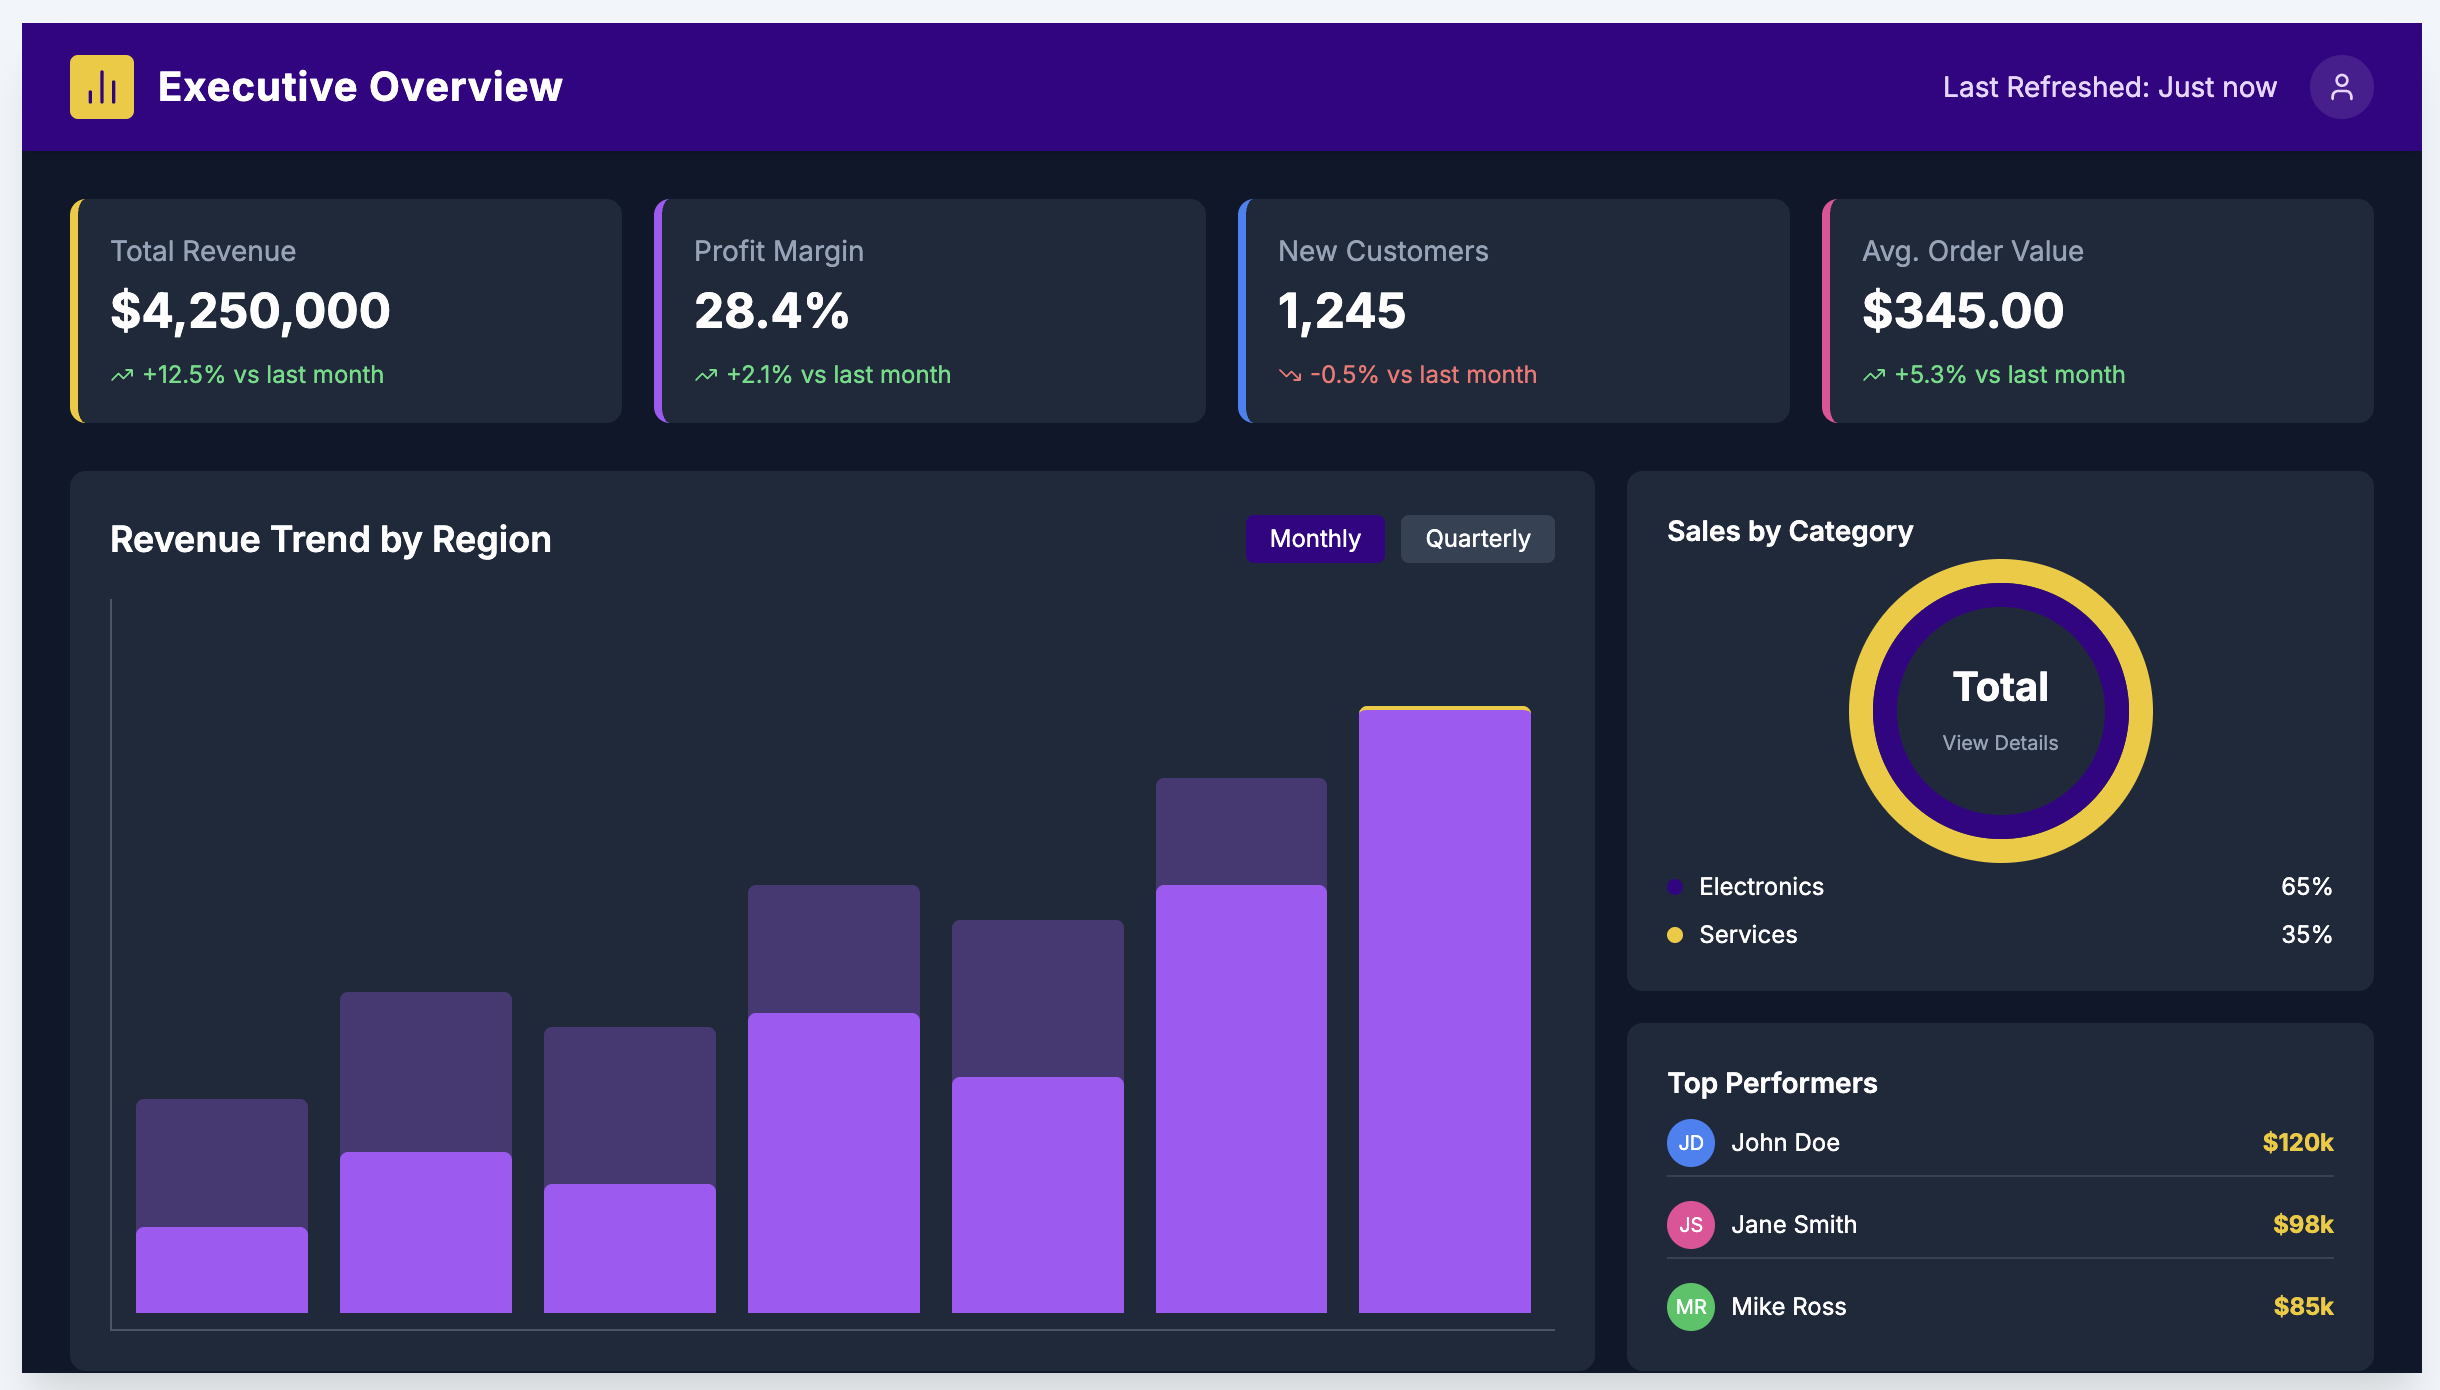
Built for action
Clear KPIs, governed measures, and drill-down paths your team can trust.
Published Australian delivery evidence
Power BI roadmap
A proposal-stage roadmap covering KPI workshops, source review, semantic modelling, validation, and handover. It explicitly makes no completed-outcome claim.
Dashboard examples
Review representative dashboard patterns for executive, finance, sales, workforce, and operational reporting.
Delivery discipline
Published cases show how Ultron documents data models, security boundaries, testing, release gates, and handover across Microsoft projects.
What changes
We focus on the decisions your reports need to support, then build the data model, experience, and controls around them.
Board-ready views with consistent KPIs, exceptions, and drill-down paths.
Optimised DAX, semantic models, aggregations, and refresh strategies.
Reusable datasets and governed measures that reduce report sprawl.
RLS, workspaces, deployment standards, documentation, and training.
Use this checklist to identify assessment questions about refresh, DAX, storage and governance. It does not measure your model or determine Fabric suitability.
This self-check is not a performance test or diagnosis. Confirm model health with representative DAX, refresh, capacity and access testing.
Dashboard examples
Explore representative Power BI experiences for leadership, finance, and operational teams.
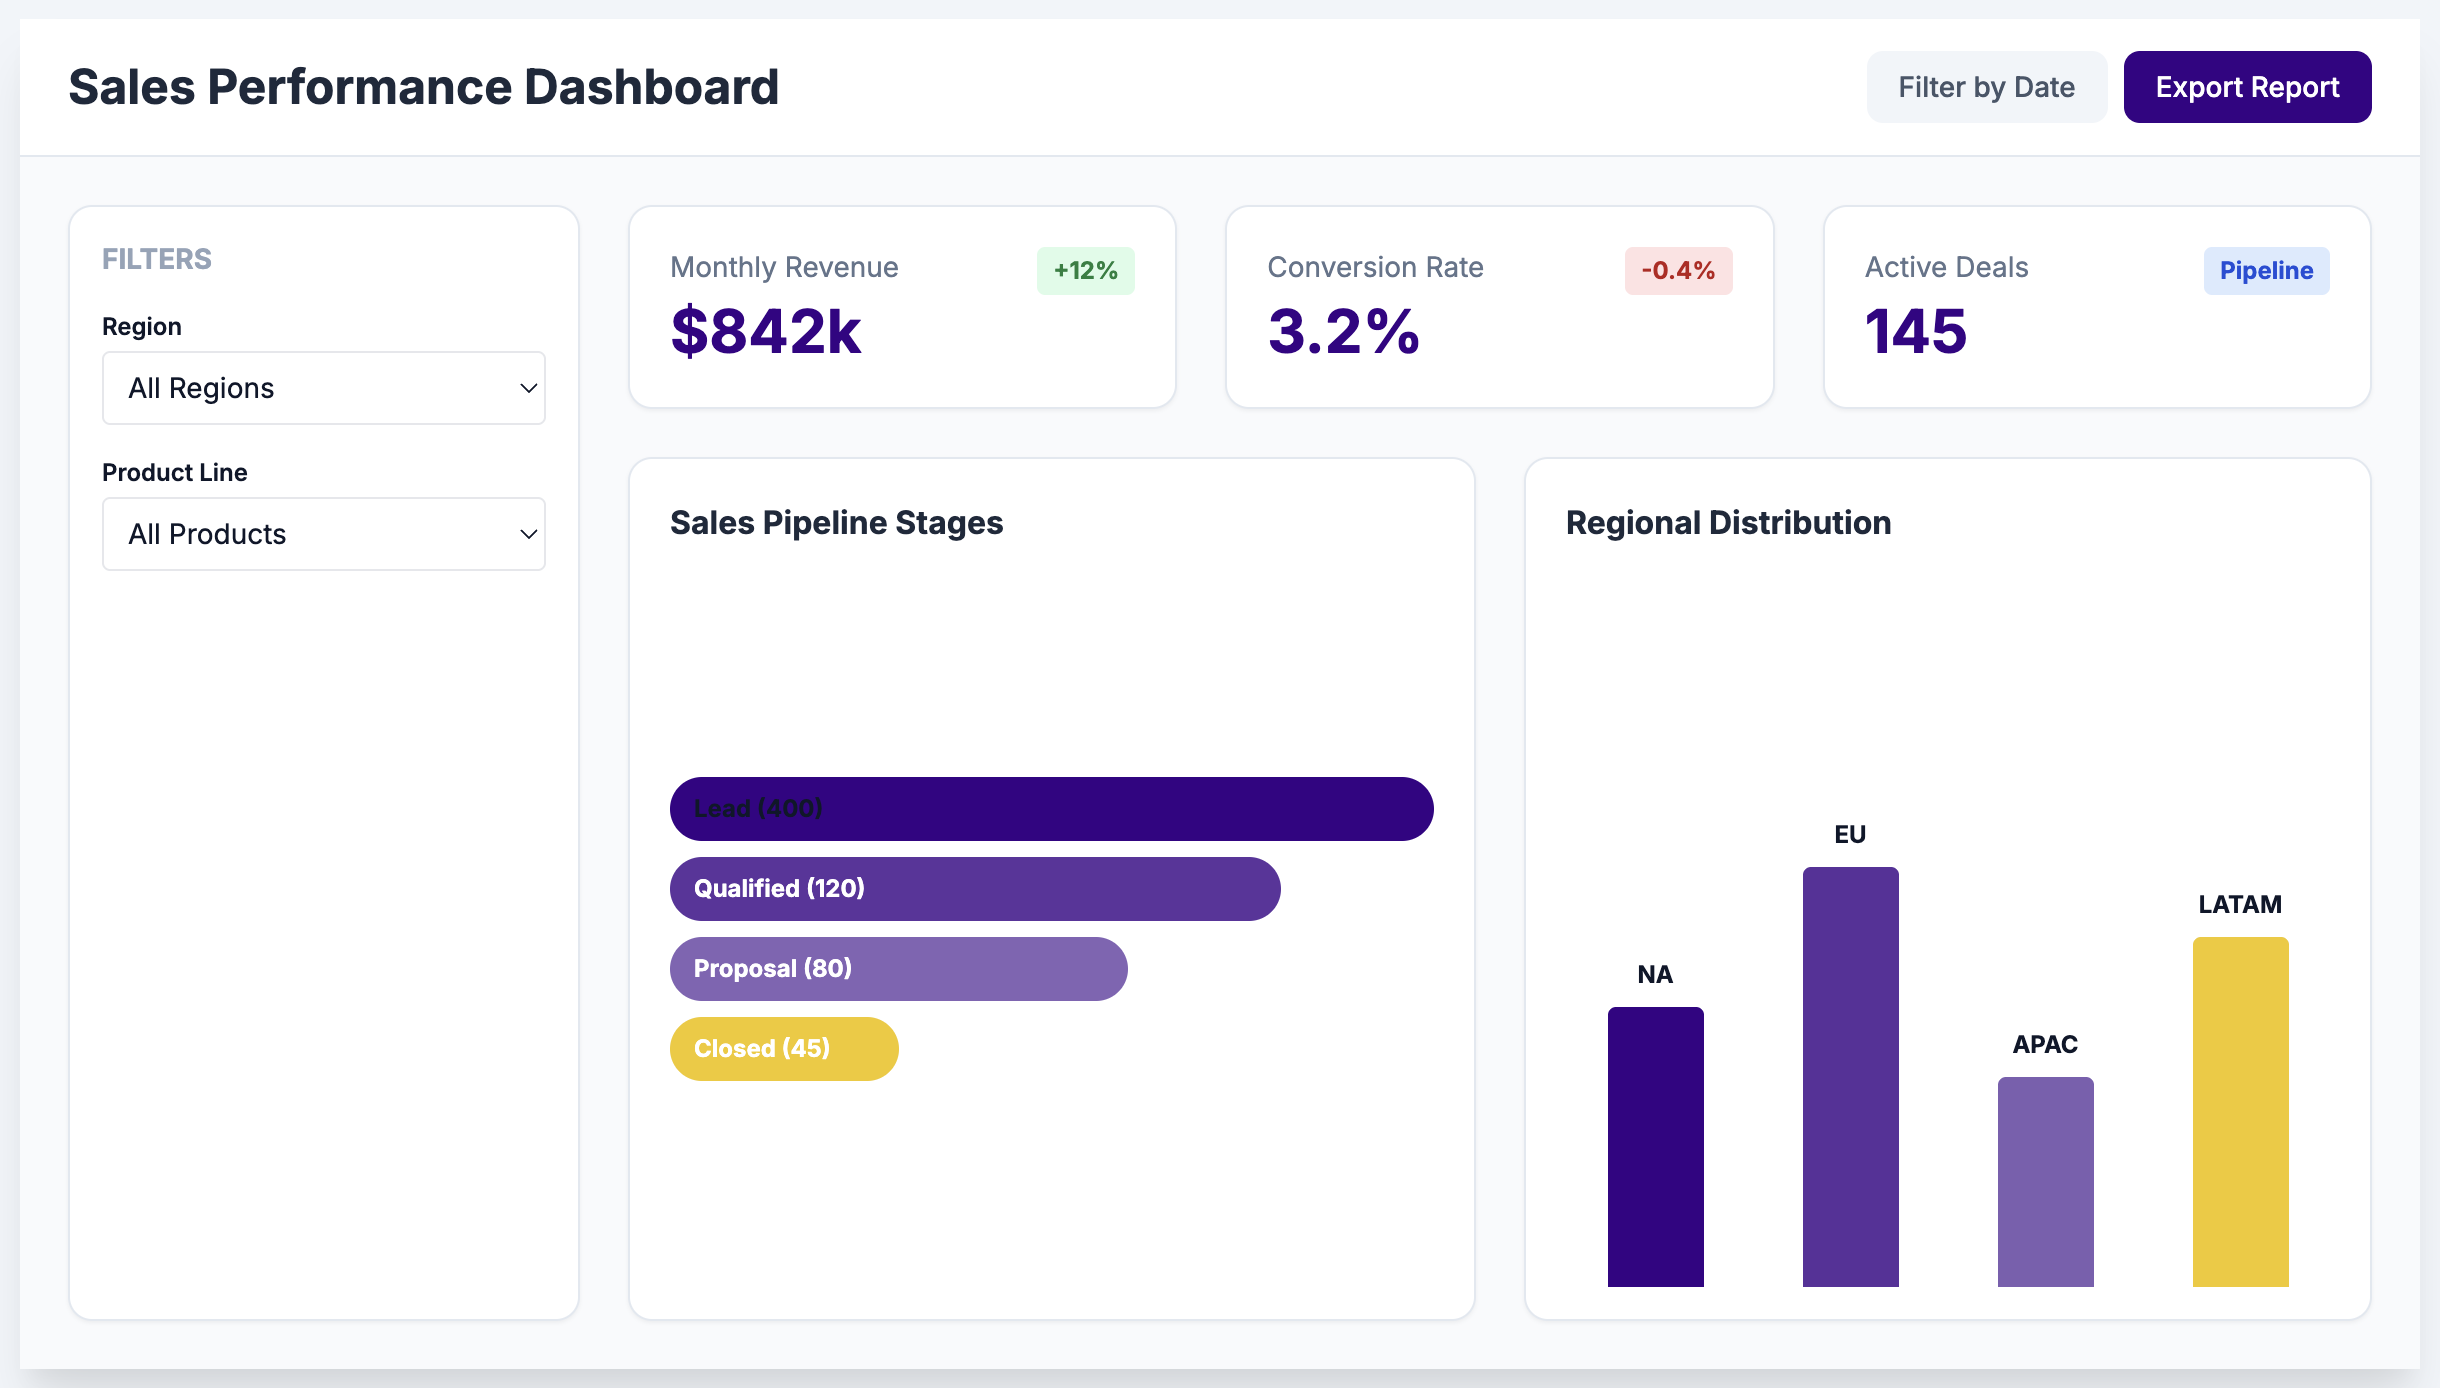
Sales leadership
Pipeline, regional performance, conversion, and target attainment in one view.
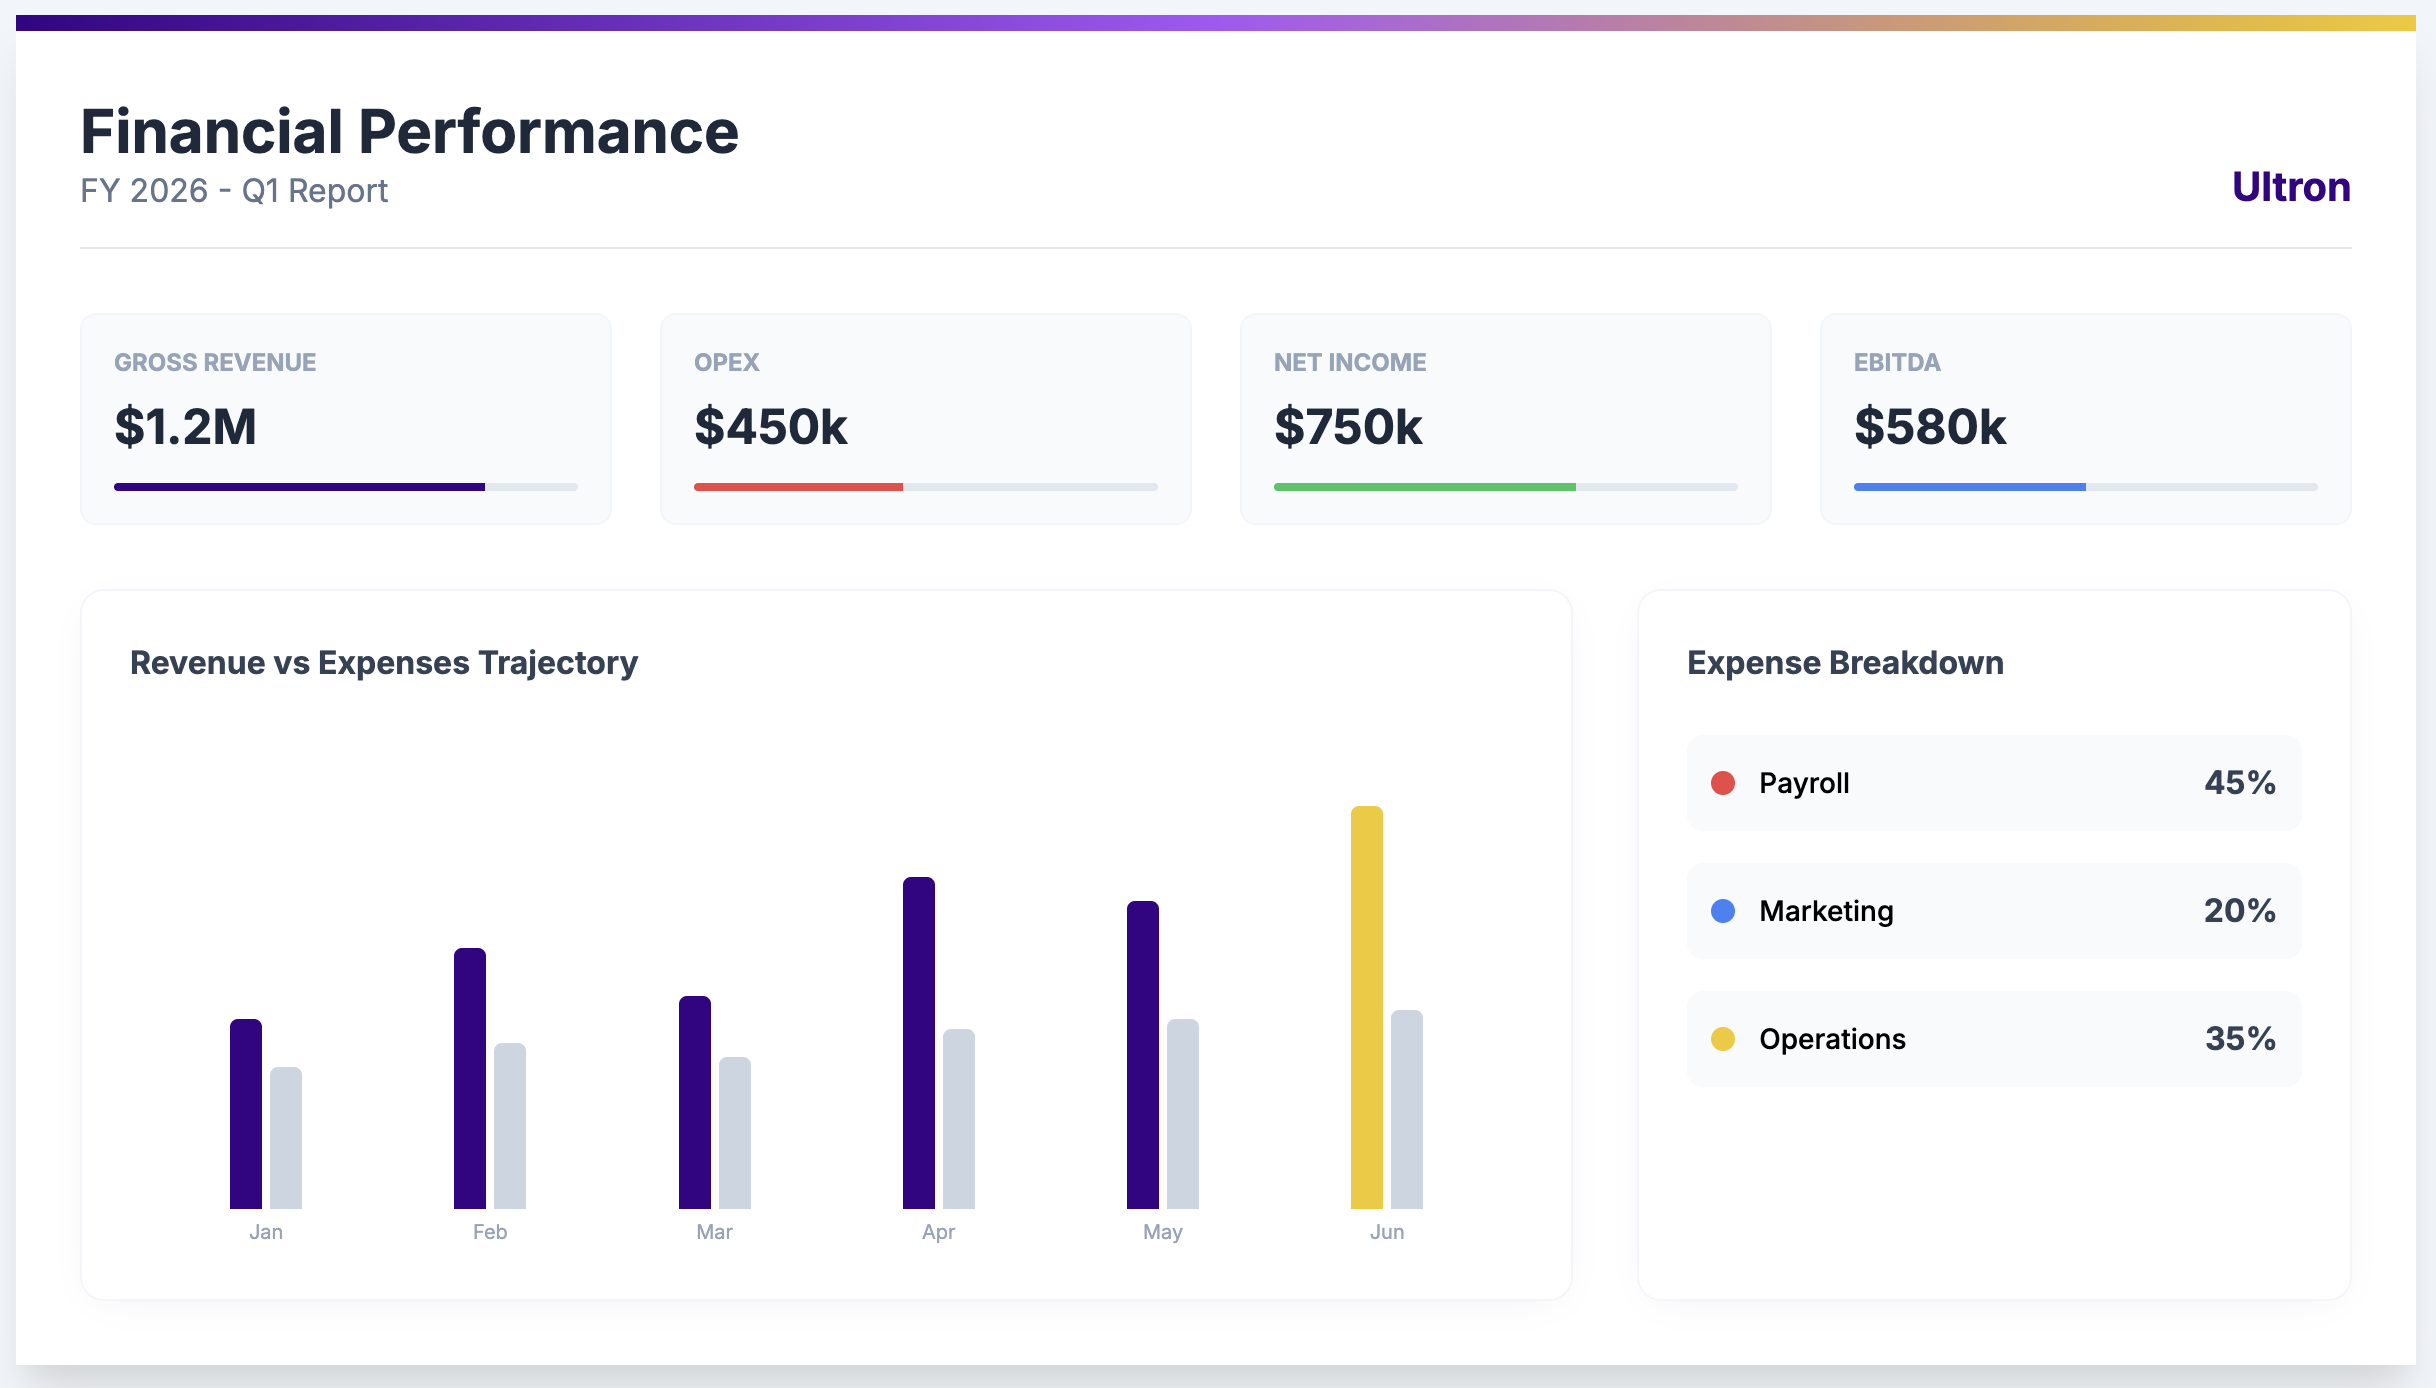
Finance
Budget variance, margin movement, expenses, and cashflow for monthly review.
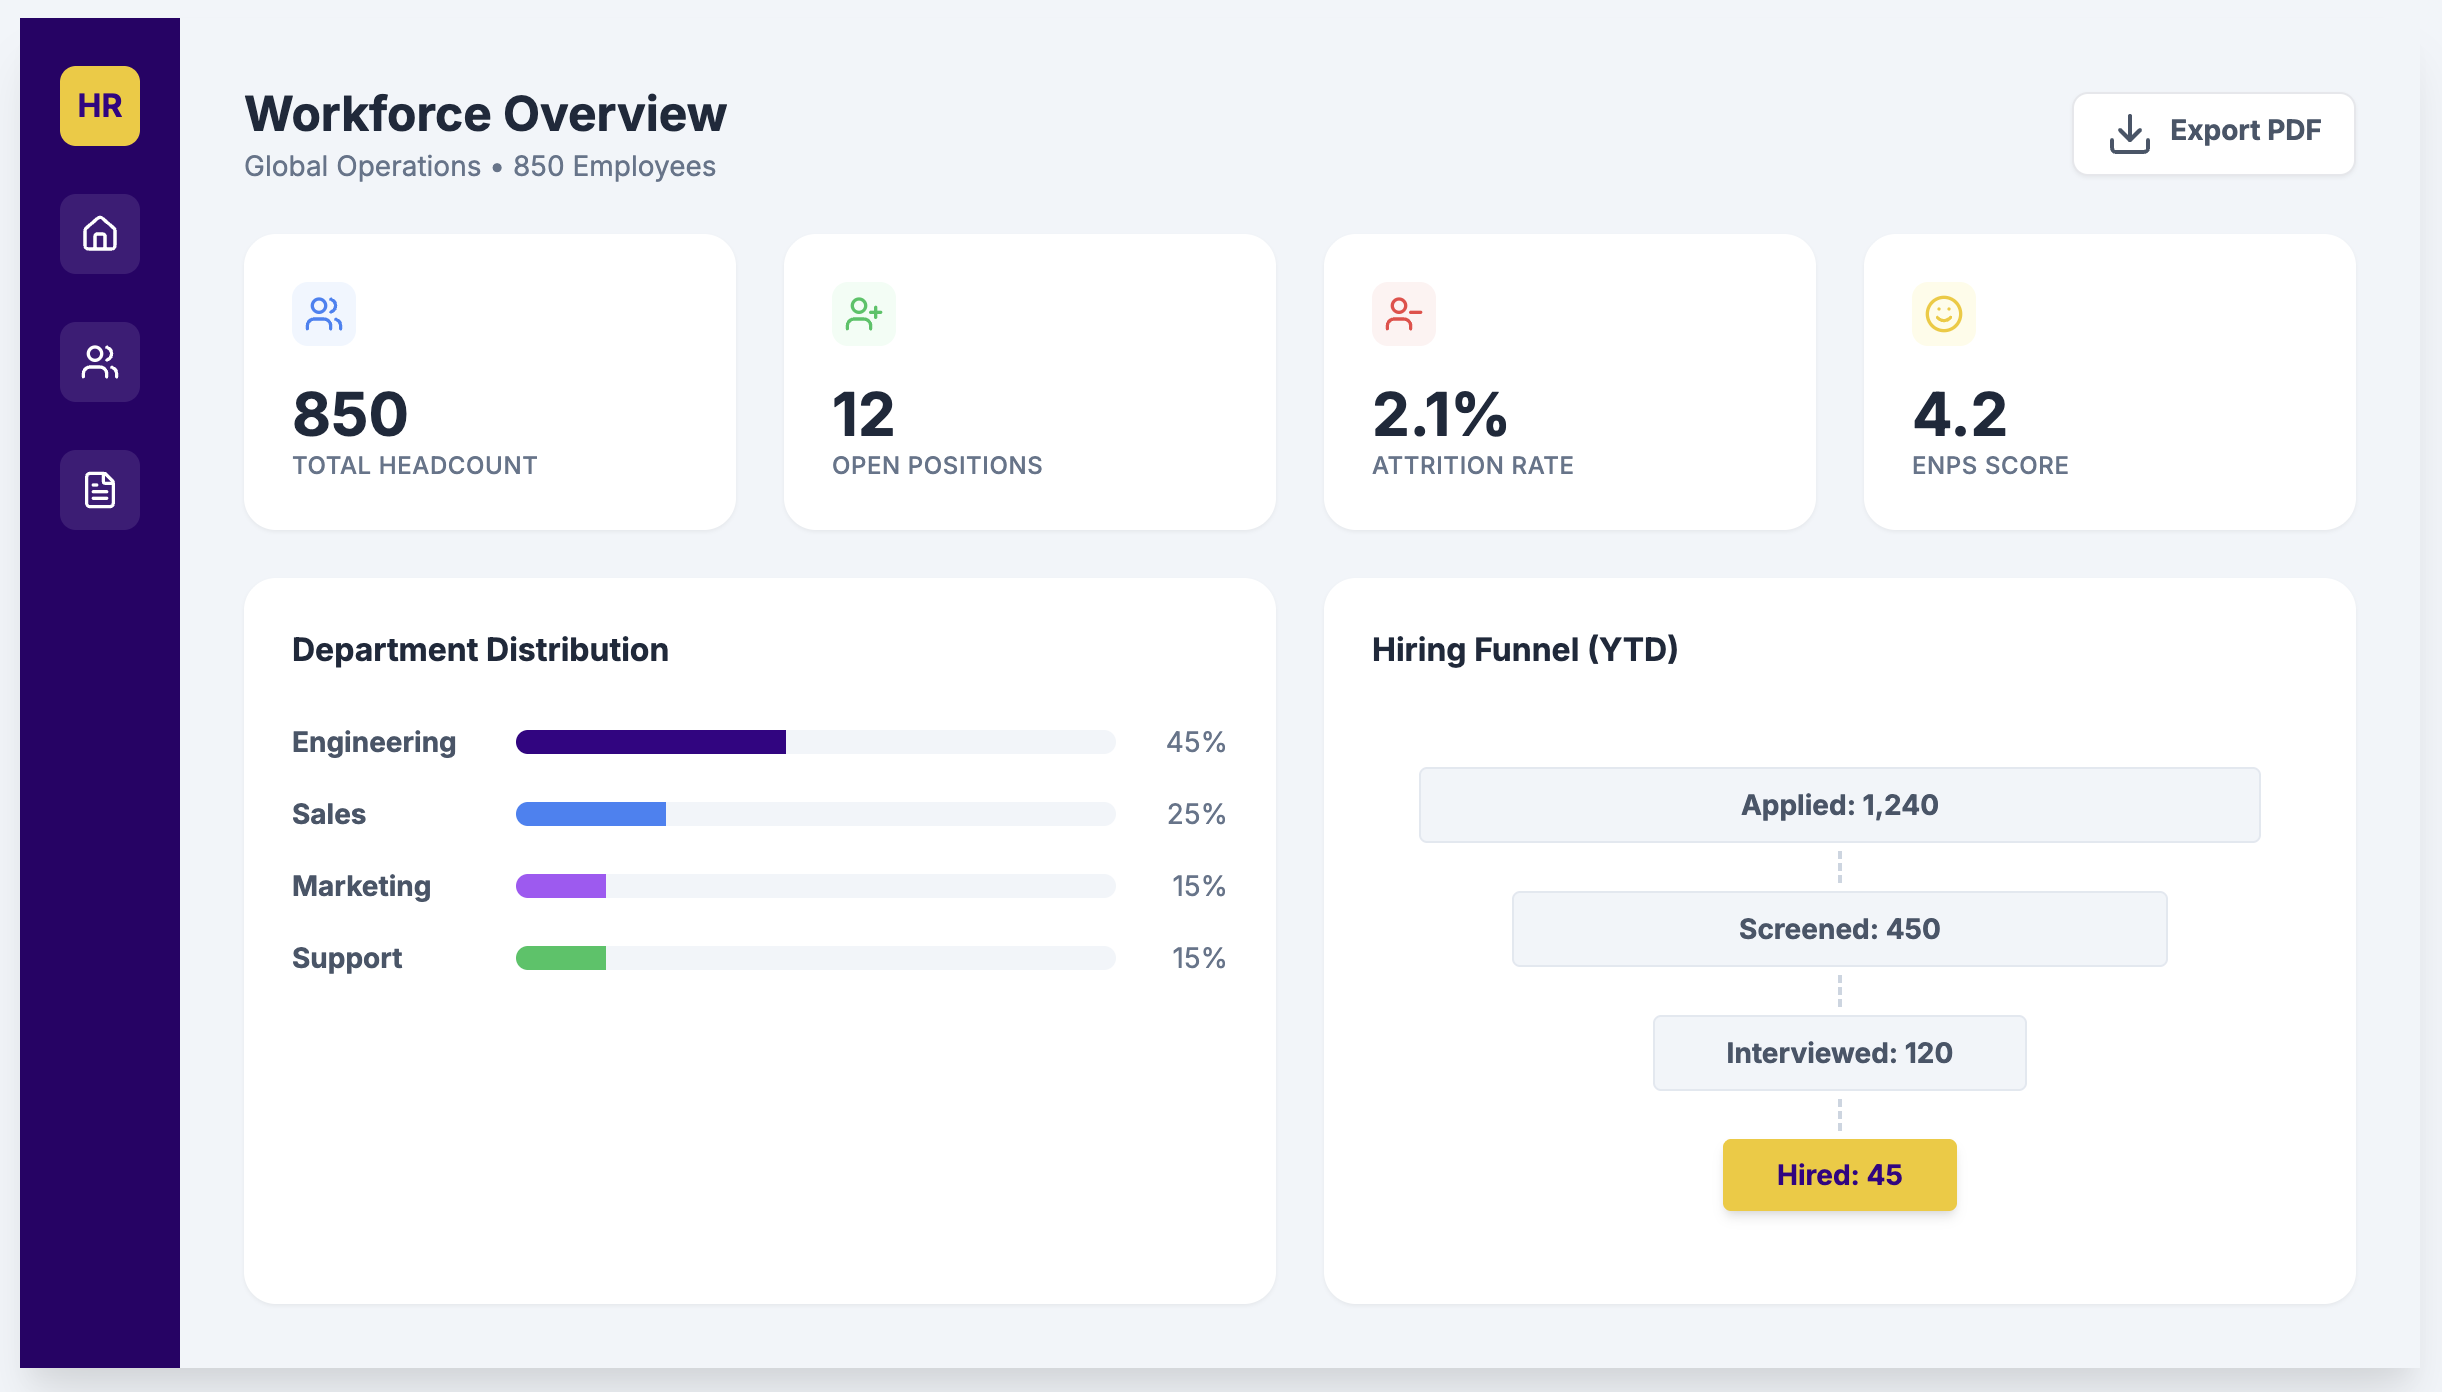
People and operations
Headcount, retention, utilisation, and workforce risk for operational planning.
End-to-end delivery
One delivery team across data strategy, dashboards, Microsoft Fabric, governance, and handover.
Delivery approach
Stakeholders see a working dashboard early, then help shape each iteration before production rollout and handover.
Discuss your reporting roadmapAudit reports, agree KPIs, map data sources, and define security and governance requirements.
Create the semantic model and working dashboard, then refine it through stakeholder reviews.
Release with RLS, workspaces, documentation, training, and an improvement backlog.
Choose the right model
A practical comparison for teams deciding whether to hire, engage a global firm, or use a focused Australian delivery partner.
| Evaluation area | Internal BI hire | Large consultancy | Ultron Developments |
|---|---|---|---|
| Microsoft data stack | Often strongest in one tool, with broader integration dependent on the individual. | Power BI can become a separate workstream across a larger program. | Power BI, Fabric, gateways, and M365 reporting delivered by one team. |
| Governance and RLS | Standards develop over time and may rely on one owner. | Comprehensive frameworks, often with a longer mobilisation period. | Workspace, RLS, pipeline, and handover standards included from the start. |
| Speed to working dashboard | Hiring, onboarding, and environment setup precede delivery. | A larger discovery phase can precede implementation. | Rapid prototyping with stakeholder review before production rollout. |
| Australian context | Depends on the candidate and internal platform knowledge. | Global standards may require localisation and additional scoping. | Australian timezone alignment and tenant-aware delivery. |
Microsoft data stack
Power BI, Fabric, gateways, and M365 reporting delivered together rather than as separate workstreams.
Governance and RLS
Workspace, RLS, deployment, documentation, and handover practices are built into delivery.
Delivery and local context
Working prototypes, stakeholder reviews, Australian timezone alignment, and tenant-aware guidance.
Australia-wide advisory
Local industry context with remote and on-site delivery for Australian organisations.
Remote and on-site delivery available
Healthcare, education, manufacturing and logistics reporting with Fabric readiness support.
Perth, WAMining, resources, energy and infrastructure reporting across distributed operations.
Sydney, NSWFinancial services, insurance and enterprise dashboards with audit-friendly access controls.
Brisbane, QLDConstruction, utilities and field services reporting for project and workforce visibility.
Adelaide, SAAdvanced manufacturing, energy and public sector reporting with controlled access models.
Canberra, ACTGoverned reporting, workspace controls, documentation and formal handover for regulated teams.
Federal and ACT government entities require strict data residency, ISM compliance, and Essential Eight security alignment. Ultron Developments architectures Power BI semantic models and Microsoft Fabric Lakehouses deployed exclusively within Australian sovereign data centres (Azure Australia East & Australia Southeast).
Book a targeted 45-minute semantic model & Fabric governance assessment for your department or enterprise data team.
Common questions
Straight answers on delivery, governance, performance, and Microsoft Fabric.
Evidence boundary
The CAHS page documents a proposed Power BI workstream and labels it as proposal-stage evidence. Other public cases show the engineering and handover discipline used across Australian Microsoft projects without claiming unmeasured BI results.
Related Microsoft services
Bring us your current reports, data sources, and priorities. We will help identify the fastest path to a trusted Power BI solution.
Australian-based team · Remote and on-site delivery