
Construction, utility, resources or field service reporting depends on manual project updates.
We help clarify the business question, model the data and produce a maintainable reporting path.
Brisbane, Queensland
Power BI consultant Brisbane for dashboards, models, governance and implementation
Brisbane organisations often need reporting for projects, assets, field teams and regional operations. Ultron helps turn operational data into Power BI dashboards and models that support delivery, workforce and executive visibility.
Practical triggers
A consultant is most useful when reporting has become important enough that model design, security, refresh and handover need more discipline.
We help clarify the business question, model the data and produce a maintainable reporting path.
We help clarify the business question, model the data and produce a maintainable reporting path.
We help clarify the business question, model the data and produce a maintainable reporting path.
We help clarify the business question, model the data and produce a maintainable reporting path.
Local reporting challenges
Cost, schedule, workforce, asset and risk data often live in separate systems and require consistent modelling.
Reports need to work for head office, regional managers and field teams without exposing unnecessary detail.
Progress, safety, quality, claims, maintenance and service measures require agreed definitions and refresh cadence.
RLS, app audiences and workspace permissions must reflect regions, projects, contractors and business units.
Services
Engagements can include a narrow dashboard build, a model remediation sprint or a broader implementation and governance programme.
Executive, operational and team dashboards designed around decisions, not decorative charts.
Star-schema models, measure tables and documented definitions that support consistent reporting.
Readable measures, calculation groups where useful, and review of complex business logic.
Assessment of whether Fabric, lakehouse or warehouse patterns are useful for your reporting estate.
Workspace standards, ownership models, endorsement paths and Centre of Excellence guidance.
RLS patterns aligned to roles, teams, regions, projects or other approved access rules.
Workspace structure, app distribution, Entra ID group alignment and permission reviews.
Gateway configuration, scheduled refresh design, source credentials and failure triage.
Development, test and production promotion processes for controlled release management.
Hands-on build, migration or remediation from discovery through production rollout.
Runbooks, data dictionaries, user guidance and analyst handover sessions.
Backlog support, performance tuning, refresh troubleshooting and ongoing improvement cycles.
Engagement options
Review reports, workspaces, source systems, security and refresh risks before recommending a practical roadmap.
Deliver a defined dashboard or reporting pack with agreed data sources, measures and acceptance criteria.
Target slow reports, oversized models, refresh failures and expensive DAX patterns.
Set workspace standards, ownership, deployment, access and documentation practices.
Provide recurring help for reporting backlogs, minor enhancements, refresh issues and adoption questions.
Delivery process
Stakeholder map, reporting inventory, KPI questions, source-system list and access requirements.
Semantic model approach, dashboard wireframes, security design, refresh plan and delivery backlog.
Power BI reports, DAX measures, test results, UAT feedback log and performance checks.
Production workspace, app or audience setup, deployment notes, runbook and handover session.
Relevant work
These examples show the type of reporting and Microsoft platform delivery experience that informs our Power BI work. They are not presented as named Power BI projects for a specific organisation.
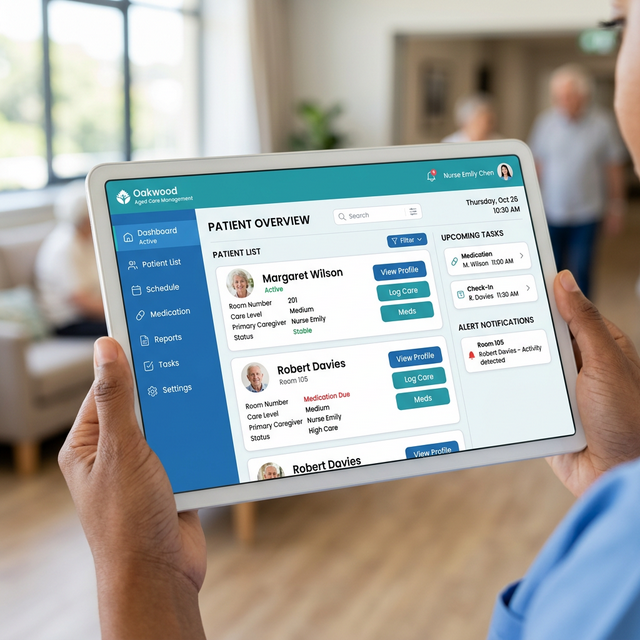
Reporting experience across operational, workforce and service delivery measures.
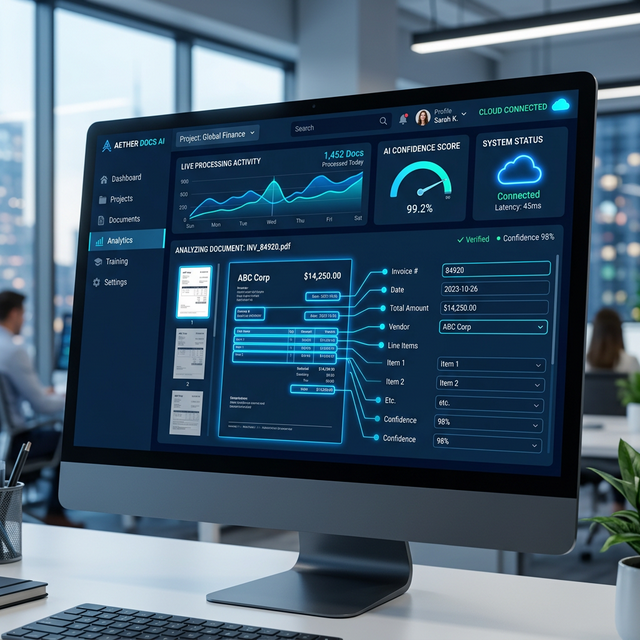
Microsoft ecosystem delivery involving structured workflows, data capture and handover.
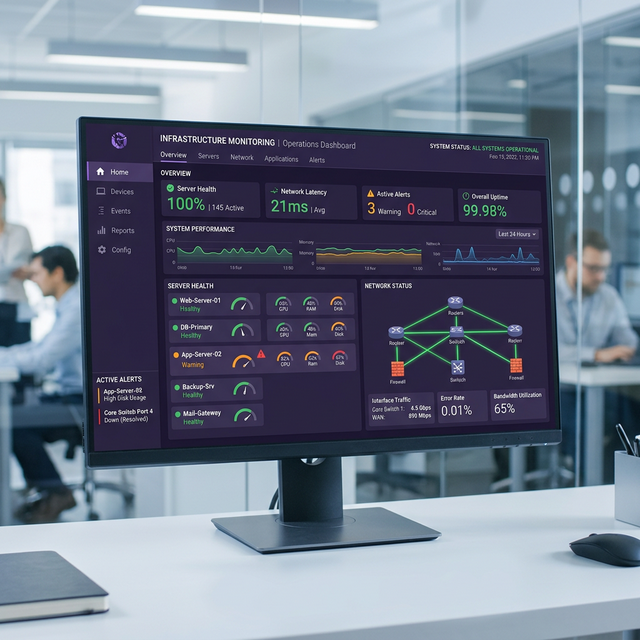
Operational reporting experience for asset, project and executive visibility.
Internal links
FAQs
Yes. We can design dashboards and models for project status, assets, workforce, cost, safety and regional performance using available source data.
We use workspace structure, app audiences and RLS so different regions, projects or teams can access appropriate views from shared reporting assets.
We can reduce manual reporting where source data is accessible and definitions are agreed, then document any remaining manual inputs clearly.
Yes. Ongoing support can cover enhancements, refresh issues, access changes, dashboard improvements and report-owner guidance.
Yes. Remote discovery is practical for many teams, with onsite or hybrid workshops available when stakeholders need to align in person.
Australian delivery proof
Review approved Australian client stories across Power Apps, Power BI, Dataverse, healthcare, mining and manufacturing.